the same as a picture (for printing)

+------------------------------------------------------------------------------
| Program Name:         step_batch.py
| Program Version:      2026-09-10 18:41:38
| Date:                 2026-09-11
| Time:                 08:50:57
| Input 1 - Raw CSV:    indpensim_process.csv  (100 batches, 23 tags)
| Input 2 - Glossary:   indpensim_schema.csv
| Input 3 - Time stamp: aligned onto 100 points of batch progress
+------------------------------------------------------------------------------
Three steps, so any number in this report can be traced back to the file it was downloaded from. The links open the file or its folder on this machine.
| What | File | |
|---|---|---|
| 1. Raw data, as downloaded | 100_Batches_IndPenSim_V3.csv /Volumes/YN-4T/WIP/CTRL-Designer/B-CDL-Data-Analysis/A-Raw-Data/IndPenSim | open the folder |
| 2. Program that converted it | make_indpensim.py /Users/yahyanazer/Dropbox/__C_2026_Work/CTRL-Designer/B-CDL-Data-Analysis/B-Engines | open the folder |
| 3. Data used for this analysis | indpensim_process.csv /Users/yahyanazer/Dropbox/__C_2026_Work/CTRL-Designer/B-CDL-Data-Analysis/A-Raw-Data/IndPenSim | open the folder |
| Batch list | indpensim_batches.csv /Users/yahyanazer/Dropbox/__C_2026_Work/CTRL-Designer/B-CDL-Data-Analysis/A-Raw-Data/IndPenSim | open the folder |
| Glossary | indpensim_schema.csv /Users/yahyanazer/Dropbox/__C_2026_Work/CTRL-Designer/B-CDL-Data-Analysis/A-Raw-Data/IndPenSim | open the folder |
| Data sheet | data-source.md /Users/yahyanazer/Dropbox/__C_2026_Work/CTRL-Designer/B-CDL-Data-Analysis/A-Raw-Data/IndPenSim | open the folder |
| Batches | 100 |
|---|---|
| Tags used | 23 |
| Batch length | 167 to 290 h (median 230 h) |
| Alignment | every batch stretched onto 100 points of 0–100% progress, because they run to different lengths |
| Corridor | mean ± 3 sigma of the reference batches |
| Strategy | Batches | Mean length | Mean yield |
|---|---|---|---|
| APC with Raman | 30 | 225 h | 3,484,283 kg |
| faulty | 10 | 230 h | 2,600,203 kg |
| operator controlled | 30 | 229 h | 2,833,113 kg |
| recipe driven | 30 | 229 h | 2,912,750 kg |
The corridor for every tag is drawn in section 6. Here is what the whole set looks like measured against it:
Each batch is placed by its worst single point — how far from the golden batch it ever got, in sigma. That is the plain reading of "stays within ± so many sigma". The sustained figure beside it is the 99.9th percentile, which ignores one bad sample and says where the batch really lived.
| Band | Batches | How far | Which | |
|---|---|---|---|---|
| 1 | Near the golden batch — within 2 sigma | 0 | none | |
| 2 | Similar — 2 to 5 sigma | 27 | worst point 2–5 sigma sustained 4 sigma (median) | Batch 4 - recipe driven, Batch 8 - recipe driven, Batch 10 - recipe driven, Batch 16 - recipe driven, Batch 22 - recipe driven, Batch 24 - recipe driven, Batch 31 - operator controlled, Batch 32 - operator controlled, Batch 33 - operator controlled, Batch 34 - operator controlled, Batch 35 - operator controlled, Batch 36 - operator controlled, Batch 37 - operator controlled, Batch 38 - operator controlled, Batch 39 - operator controlled, Batch 40 - operator controlled, Batch 41 - operator controlled, Batch 42 - operator controlled, Batch 43 - operator controlled, Batch 44 - operator controlled, Batch 45 - operator controlled, Batch 46 - operator controlled … |
| 3 | Outside — 5 to 10 sigma | 7 | worst point 5–10 sigma sustained 5 sigma (median) | Batch 2 - recipe driven, Batch 12 - recipe driven, Batch 14 - recipe driven, Batch 20 - recipe driven, Batch 25 - recipe driven, Batch 26 - recipe driven, Batch 54 - operator controlled |
| 4 | Far from it — over 10 sigma | 66 | worst point 10–183 sigma sustained 36 sigma (median) | Batch 1 - recipe driven, Batch 3 - recipe driven, Batch 5 - recipe driven, Batch 6 - recipe driven, Batch 7 - recipe driven, Batch 9 - recipe driven, Batch 11 - recipe driven, Batch 13 - recipe driven, Batch 15 - recipe driven, Batch 17 - recipe driven, Batch 18 - recipe driven, Batch 19 - recipe driven, Batch 21 - recipe driven, Batch 23 - recipe driven, Batch 27 - recipe driven, Batch 28 - recipe driven, Batch 29 - recipe driven, Batch 30 - recipe driven, Batch 51 - operator controlled, Batch 52 - operator controlled, Batch 53 - operator controlled, Batch 55 - operator controlled … |
The 66 batches beyond 10 sigma, worst first. "Worst tag" is the single tag furthest from the golden batch, and "at" is where in the batch that happened.
| Batch | Fault recorded | Worst point | Worst tag | at | first left | time outside | |
|---|---|---|---|---|---|---|---|
| 100 | faulty | yes | 183 sigma | aeration_rate | 46% | 9% | 5.5% |
| 94 | faulty | yes | 183 sigma | aeration_rate | 46% | 9% | 7.2% |
| 51 | operator controlled | no | 178 sigma | acid_flow_rate | 86% | 1% | 1.2% |
| 59 | operator controlled | no | 172 sigma | acid_flow_rate | 85% | 7% | 2.9% |
| 67 | APC with Raman | no | 166 sigma | ph | 48% | 2% | 20.0% |
| 97 | faulty | yes | 162 sigma | acid_flow_rate | 77% | 9% | 4.9% |
| 91 | faulty | yes | 156 sigma | substrate_conc | 46% | 5% | 19.5% |
| 9 | recipe driven | no | 152 sigma | acid_flow_rate | 61% | 10% | 4.6% |
| 93 | faulty | yes | 135 sigma | temperature | 42% | 1% | 3.6% |
| 99 | faulty | yes | 135 sigma | acid_flow_rate | 77% | 3% | 12.3% |
| 95 | faulty | yes | 115 sigma | acid_flow_rate | 63% | 10% | 12.8% |
| 3 | recipe driven | no | 113 sigma | acid_flow_rate | 98% | 1% | 12.0% |
| 92 | faulty | yes | 111 sigma | ph | 69% | 7% | 1.9% |
| 98 | faulty | yes | 98 sigma | ph | 69% | 6% | 1.4% |
| 76 | APC with Raman | no | 78 sigma | heat_water_flow | 15% | 2% | 1.8% |
| 7 | recipe driven | no | 75 sigma | ph | 86% | 1% | 3.2% |
| 15 | recipe driven | no | 67 sigma | head_pressure | 21% | 2% | 10.3% |
| 5 | recipe driven | no | 67 sigma | head_pressure | 21% | 2% | 10.3% |
| 68 | APC with Raman | no | 66 sigma | paa_flow | 38% | 2% | 2.9% |
| 70 | APC with Raman | no | 66 sigma | paa_flow | 38% | 5% | 2.7% |
| 29 | recipe driven | no | 66 sigma | paa_flow | 14% | 1% | 12.0% |
| 17 | recipe driven | no | 65 sigma | water_injection | 26% | 2% | 5.6% |
| 75 | APC with Raman | no | 62 sigma | heat_water_flow | 14% | 2% | 10.6% |
| 28 | recipe driven | no | 59 sigma | acid_flow_rate | 78% | 61% | 0.7% |
| 23 | recipe driven | no | 56 sigma | paa_flow | 15% | 3% | 4.2% |
| 53 | operator controlled | no | 52 sigma | water_injection | 38% | 0% | 9.8% |
| 64 | APC with Raman | no | 47 sigma | paa_flow | 39% | 0% | 2.3% |
| 61 | APC with Raman | no | 46 sigma | dumped_broth_flow | 54% | 3% | 6.4% |
| 85 | APC with Raman | no | 46 sigma | dumped_broth_flow | 76% | 6% | 5.6% |
| 55 | operator controlled | no | 46 sigma | dumped_broth_flow | 46% | 0% | 1.0% |
| 1 | recipe driven | no | 46 sigma | dumped_broth_flow | 76% | 0% | 2.0% |
| 19 | recipe driven | no | 46 sigma | dumped_broth_flow | 64% | 11% | 1.6% |
| 13 | recipe driven | no | 46 sigma | dumped_broth_flow | 46% | 11% | 1.5% |
| 27 | recipe driven | no | 46 sigma | dumped_broth_flow | 48% | 11% | 2.0% |
| 71 | APC with Raman | no | 46 sigma | dumped_broth_flow | 48% | 6% | 3.2% |
| 81 | APC with Raman | no | 46 sigma | dumped_broth_flow | 60% | 7% | 2.1% |
| 73 | APC with Raman | no | 46 sigma | dumped_broth_flow | 42% | 5% | 9.2% |
| 57 | operator controlled | no | 46 sigma | dumped_broth_flow | 99% | 34% | 0.5% |
| 87 | APC with Raman | no | 46 sigma | dumped_broth_flow | 46% | 0% | 2.6% |
| 83 | APC with Raman | no | 46 sigma | dumped_broth_flow | 54% | 5% | 3.3% |
| 77 | APC with Raman | no | 46 sigma | dumped_broth_flow | 50% | 10% | 3.3% |
| 69 | APC with Raman | no | 46 sigma | dumped_broth_flow | 59% | 10% | 4.2% |
| 65 | APC with Raman | no | 41 sigma | paa_flow | 10% | 0% | 1.6% |
| 62 | APC with Raman | no | 41 sigma | paa_flow | 15% | 10% | 1.7% |
| 80 | APC with Raman | no | 39 sigma | paa_flow | 15% | 10% | 1.9% |
| 74 | APC with Raman | no | 39 sigma | paa_flow | 15% | 5% | 1.4% |
| 78 | APC with Raman | no | 39 sigma | paa_flow | 12% | 1% | 3.0% |
| 89 | APC with Raman | no | 38 sigma | paa_flow | 39% | 5% | 3.6% |
| 90 | APC with Raman | no | 38 sigma | paa_flow | 12% | 0% | 1.6% |
| 84 | APC with Raman | no | 38 sigma | paa_flow | 15% | 0% | 2.1% |
| 79 | APC with Raman | no | 37 sigma | paa_flow | 15% | 10% | 2.0% |
| 82 | APC with Raman | no | 36 sigma | paa_flow | 15% | 11% | 1.8% |
| 88 | APC with Raman | no | 36 sigma | paa_flow | 15% | 3% | 1.8% |
| 63 | APC with Raman | no | 34 sigma | paa_flow | 15% | 11% | 1.9% |
| 86 | APC with Raman | no | 34 sigma | paa_flow | 12% | 11% | 1.9% |
| 72 | APC with Raman | no | 33 sigma | paa_flow | 15% | 10% | 1.4% |
| 66 | APC with Raman | no | 32 sigma | paa_flow | 12% | 3% | 3.5% |
| 96 | faulty | yes | 30 sigma | temperature | 36% | 33% | 2.0% |
| 30 | recipe driven | no | 26 sigma | acid_flow_rate | 58% | 1% | 1.5% |
| 52 | operator controlled | no | 22 sigma | heat_water_flow | 20% | 2% | 0.6% |
| 21 | recipe driven | no | 20 sigma | heat_water_flow | 5% | 3% | 1.8% |
| 11 | recipe driven | no | 19 sigma | sugar_feed_rate | 38% | 6% | 2.1% |
| 6 | recipe driven | no | 14 sigma | acid_flow_rate | 37% | 6% | 2.4% |
| 60 | operator controlled | no | 12 sigma | temperature | 24% | 18% | 0.4% |
| 18 | recipe driven | no | 11 sigma | acid_flow_rate | 40% | 17% | 1.3% |
| 58 | operator controlled | no | 10 sigma | acid_flow_rate | 35% | 5% | 0.2% |
Each chart holds every tag of that batch on one axis, measured in sigma from the golden batch. The green line at zero is the golden trajectory, the dashed red lines are the ±3 sigma corridor. The tags driving the batch are bold, the rest are faint behind them so you can still see whether the whole batch moved or only a few tags.

What the chart shows. ph carries most of it, running 166 sigma below the golden batch at 47% of the way through; 20 of 23 tags leave the corridor at some point; the first departure is at 2%, almost from the start; a large share of the batch sits outside, so this batch did not recover.
The numbers. SPE 305387 against a limit of 520 (587.2x); T² 25 against a limit of 18 (1.4x); 20.0% of the batch sits outside the golden corridor.
Driven by: ph (51%), head_pressure (12%), water_injection (11%), oil_flow (9%), aeration_rate (7%)

What the chart shows. substrate_conc carries most of it, running 156 sigma above the golden batch at 45% of the way through; 19 of 23 tags leave the corridor at some point; the first departure is at 5%, almost from the start; a large share of the batch sits outside, so this batch did not recover.
The numbers. SPE 162277 against a limit of 520 (312.0x); T² 36 against a limit of 18 (2.0x); 19.5% of the batch sits outside the golden corridor.
Driven by: substrate_conc (59%), acid_flow_rate (33%), dumped_broth_flow (3%), sugar_feed_rate (2%), temperature (0%)

What the chart shows. aeration_rate carries most of it, running 183 sigma below the golden batch at 46% of the way through; 14 of 23 tags leave the corridor at some point; the first departure is at 9%, almost from the start.
The numbers. SPE 108798 against a limit of 520 (209.2x); T² 34 against a limit of 18 (1.9x); 7.2% of the batch sits outside the golden corridor.
Driven by: aeration_rate (63%), acid_flow_rate (17%), co2_offgas (6%), cool_water_flow (5%), temperature (3%)

What the chart shows. aeration_rate carries most of it, running 183 sigma below the golden batch at 46% of the way through; 16 of 23 tags leave the corridor at some point; the first departure is at 9%, almost from the start.
The numbers. SPE 104893 against a limit of 520 (201.7x); T² 19 against a limit of 18 (1.1x); 5.5% of the batch sits outside the golden corridor.
Driven by: aeration_rate (65%), acid_flow_rate (18%), co2_offgas (9%), o2_offgas (4%), substrate_conc (2%)
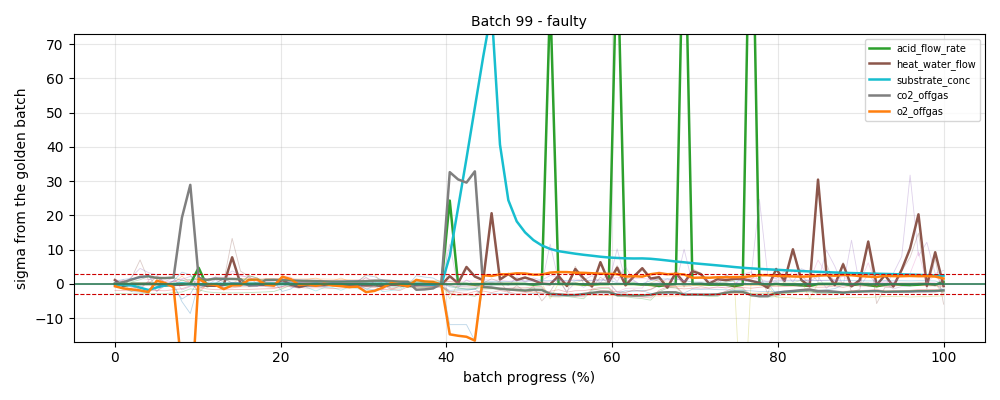
What the chart shows. acid_flow_rate carries most of it, running 135 sigma above the golden batch at 77% of the way through; 19 of 23 tags leave the corridor at some point; the first departure is at 3%, almost from the start.
The numbers. SPE 89135 against a limit of 520 (171.4x); T² 21 against a limit of 18 (1.2x); 12.3% of the batch sits outside the golden corridor.
Driven by: acid_flow_rate (56%), substrate_conc (20%), co2_offgas (6%), o2_offgas (4%), heat_water_flow (3%)

What the chart shows. acid_flow_rate carries most of it, running 178 sigma above the golden batch at 86% of the way through; 8 of 23 tags leave the corridor at some point; the first departure is at 1%, almost from the start; only a small part of the batch is outside, so this is a short, sharp deviation rather than a batch that ran wrong throughout.
The numbers. SPE 85332 against a limit of 520 (164.1x); 1.2% of the batch sits outside the golden corridor.
Driven by: acid_flow_rate (90%), dumped_broth_flow (8%), ph (1%), sugar_feed_rate (1%), cool_water_flow (0%)

What the chart shows. head_pressure carries most of it, running 67 sigma below the golden batch at 21% of the way through; 20 of 23 tags leave the corridor at some point; the first departure is at 2%, almost from the start.
The numbers. SPE 82483 against a limit of 520 (158.6x); 10.3% of the batch sits outside the golden corridor.
Driven by: head_pressure (27%), water_injection (24%), oil_flow (16%), aeration_rate (14%), paa_flow (11%)

What the chart shows. water_injection carries most of it, running 65 sigma below the golden batch at 26% of the way through; 22 of 23 tags leave the corridor at some point; the first departure is at 2%, almost from the start.
The numbers. SPE 69122 against a limit of 520 (132.9x); 10.3% of the batch sits outside the golden corridor.
Driven by: water_injection (26%), head_pressure (24%), aeration_rate (15%), oil_flow (14%), paa_flow (6%)
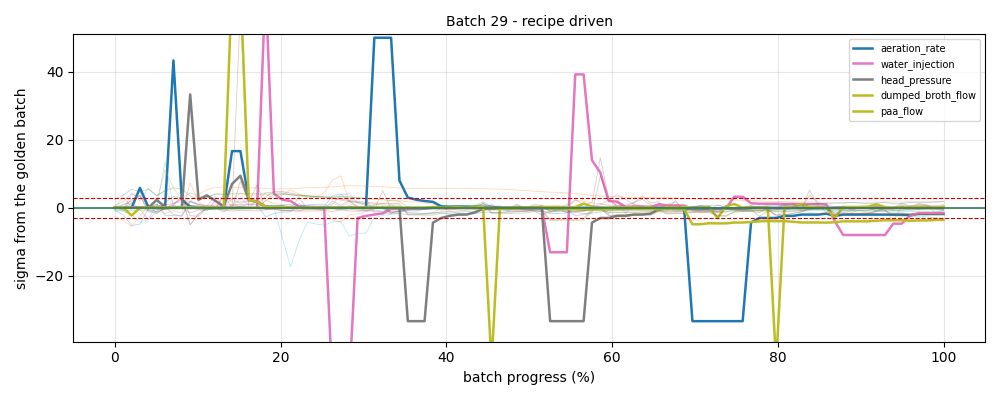
What the chart shows. aeration_rate carries most of it, running 50 sigma above the golden batch at 31% of the way through; 21 of 23 tags leave the corridor at some point; the first departure is at 1%, almost from the start.
The numbers. SPE 66864 against a limit of 520 (128.6x); 12.0% of the batch sits outside the golden corridor.
Driven by: aeration_rate (27%), water_injection (26%), head_pressure (15%), paa_flow (14%), dumped_broth_flow (6%)
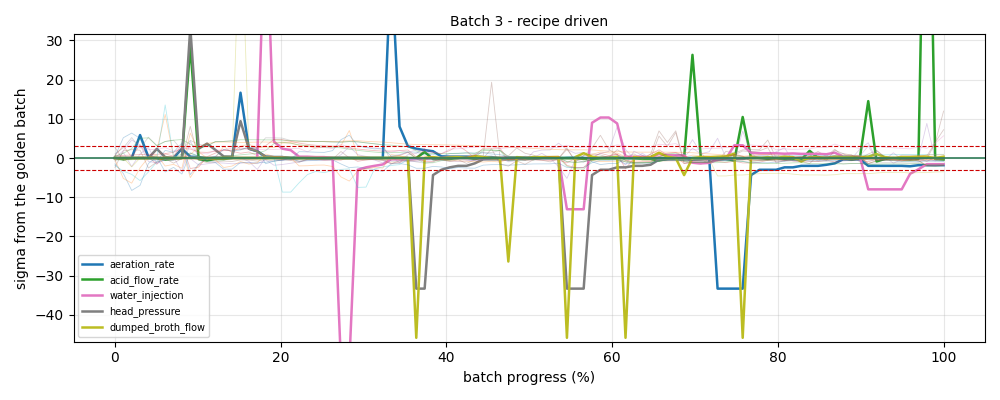
What the chart shows. acid_flow_rate carries most of it, running 113 sigma above the golden batch at 98% of the way through; 23 of 23 tags leave the corridor at some point; the first departure is at 1%, almost from the start.
The numbers. SPE 58789 against a limit of 520 (113.0x); 12.0% of the batch sits outside the golden corridor.
Driven by: acid_flow_rate (25%), water_injection (19%), dumped_broth_flow (16%), aeration_rate (12%), head_pressure (12%)
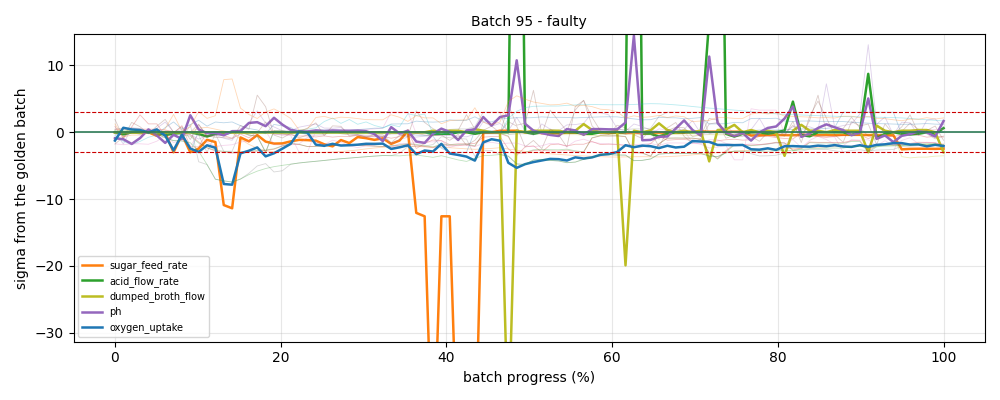
What the chart shows. acid_flow_rate carries most of it, running 115 sigma above the golden batch at 63% of the way through; 20 of 23 tags leave the corridor at some point; the first departure is at 10%, early in the batch.
The numbers. SPE 49801 against a limit of 520 (95.8x); T² 21 against a limit of 18 (1.2x); 12.8% of the batch sits outside the golden corridor.
Driven by: acid_flow_rate (62%), sugar_feed_rate (24%), dumped_broth_flow (5%), ph (1%), oxygen_uptake (1%)
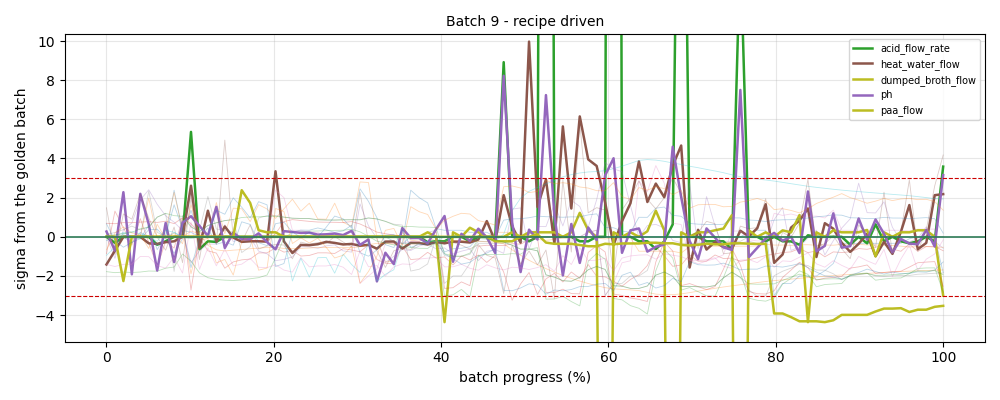
What the chart shows. acid_flow_rate carries most of it, running 152 sigma above the golden batch at 61% of the way through; 14 of 23 tags leave the corridor at some point; the first departure is at 10%, early in the batch.
The numbers. SPE 47267 against a limit of 520 (90.9x); 4.6% of the batch sits outside the golden corridor.
Driven by: acid_flow_rate (82%), dumped_broth_flow (14%), ph (1%), paa_flow (1%), heat_water_flow (1%)
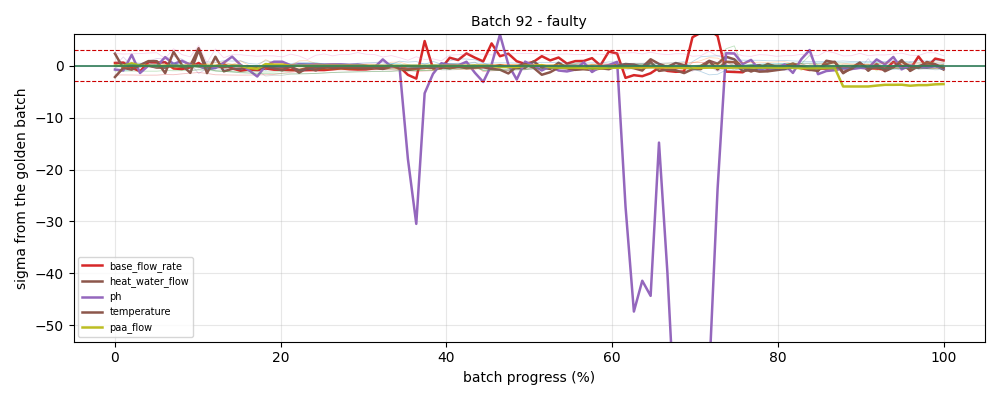
What the chart shows. ph carries most of it, running 111 sigma below the golden batch at 69% of the way through; 7 of 23 tags leave the corridor at some point; the first departure is at 7%, almost from the start; only a small part of the batch is outside, so this is a short, sharp deviation rather than a batch that ran wrong throughout.
The numbers. SPE 46354 against a limit of 520 (89.1x); 1.9% of the batch sits outside the golden corridor.
Driven by: ph (97%), base_flow_rate (1%), paa_flow (1%), temperature (0%), heat_water_flow (0%)
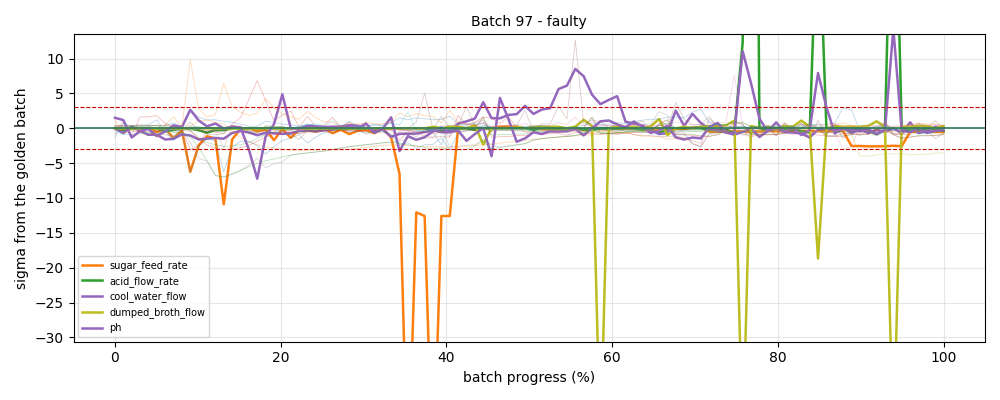
What the chart shows. acid_flow_rate carries most of it, running 162 sigma above the golden batch at 77% of the way through; 16 of 23 tags leave the corridor at some point; the first departure is at 9%, almost from the start.
The numbers. SPE 45875 against a limit of 520 (88.2x); 4.9% of the batch sits outside the golden corridor.
Driven by: acid_flow_rate (66%), dumped_broth_flow (15%), sugar_feed_rate (13%), ph (1%), cool_water_flow (1%)

What the chart shows. acid_flow_rate carries most of it, running 172 sigma above the golden batch at 85% of the way through; 16 of 23 tags leave the corridor at some point; the first departure is at 7%, almost from the start; only a small part of the batch is outside, so this is a short, sharp deviation rather than a batch that ran wrong throughout.
The numbers. SPE 42270 against a limit of 520 (81.3x); 2.9% of the batch sits outside the golden corridor.
Driven by: acid_flow_rate (81%), dumped_broth_flow (10%), heat_water_flow (4%), ph (1%), sugar_feed_rate (1%)

What the chart shows. water_injection carries most of it, running 65 sigma below the golden batch at 26% of the way through; 20 of 23 tags leave the corridor at some point; the first departure is at 2%, almost from the start.
The numbers. SPE 39735 against a limit of 520 (76.4x); 5.6% of the batch sits outside the golden corridor.
Driven by: water_injection (25%), head_pressure (23%), oil_flow (15%), aeration_rate (13%), paa_flow (7%)

What the chart shows. ph carries most of it, running 75 sigma below the golden batch at 86% of the way through; 6 of 23 tags leave the corridor at some point; the first departure is at 1%, almost from the start.
The numbers. SPE 36351 against a limit of 520 (69.9x); 3.2% of the batch sits outside the golden corridor.
Driven by: ph (95%), base_flow_rate (2%), paa_flow (1%), temperature (0%), vessel_volume (0%)
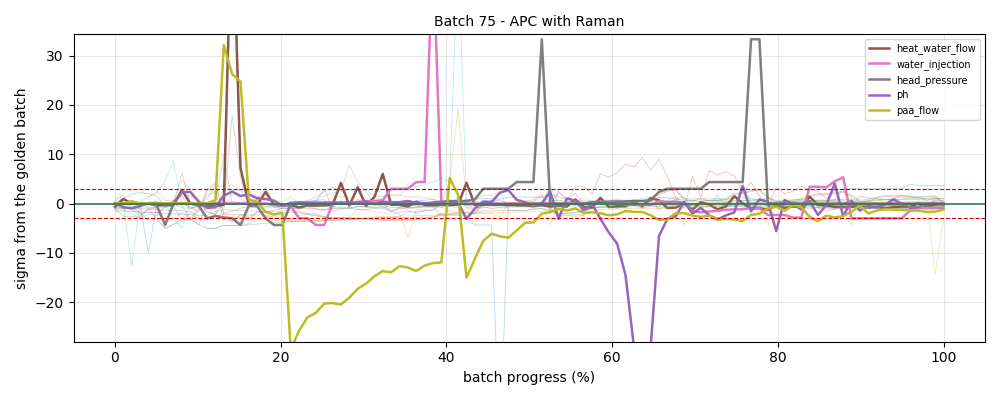
What the chart shows. paa_flow carries most of it, running 32 sigma above the golden batch at 13% of the way through; 21 of 23 tags leave the corridor at some point; the first departure is at 2%, almost from the start.
The numbers. SPE 31381 against a limit of 520 (60.3x); 10.6% of the batch sits outside the golden corridor.
Driven by: paa_flow (30%), heat_water_flow (13%), head_pressure (11%), ph (10%), water_injection (9%)

What the chart shows. ph carries most of it, running 98 sigma below the golden batch at 69% of the way through; 6 of 23 tags leave the corridor at some point; the first departure is at 6%, almost from the start; only a small part of the batch is outside, so this is a short, sharp deviation rather than a batch that ran wrong throughout.
The numbers. SPE 25741 against a limit of 520 (49.5x); 1.4% of the batch sits outside the golden corridor.
Driven by: ph (96%), paa_flow (1%), base_flow_rate (1%), generated_heat (1%), temperature (0%)

What the chart shows. temperature carries most of it, running 135 sigma above the golden batch at 42% of the way through; 17 of 23 tags leave the corridor at some point; the first departure is at 1%, almost from the start.
The numbers. SPE 23171 against a limit of 520 (44.6x); 3.6% of the batch sits outside the golden corridor.
Driven by: temperature (86%), generated_heat (3%), heat_water_flow (2%), base_flow_rate (1%), cool_water_flow (1%)

What the chart shows. paa_flow carries most of it, running 31 sigma above the golden batch at 12% of the way through; 16 of 23 tags leave the corridor at some point; the first departure is at 6%, almost from the start.
The numbers. SPE 20897 against a limit of 520 (40.2x); 3.2% of the batch sits outside the golden corridor.
Driven by: paa_flow (43%), dumped_broth_flow (41%), heat_water_flow (7%), acid_flow_rate (3%), temperature (1%)

What the chart shows. paa_flow carries most of it, running 36 sigma above the golden batch at 15% of the way through; 9 of 23 tags leave the corridor at some point; the first departure is at 5%, almost from the start.
The numbers. SPE 20597 against a limit of 520 (39.6x); 9.2% of the batch sits outside the golden corridor.
Driven by: paa_flow (41%), dumped_broth_flow (21%), ph (20%), acid_flow_rate (8%), base_flow_rate (3%)

What the chart shows. paa_flow carries most of it, running 66 sigma below the golden batch at 38% of the way through; 7 of 23 tags leave the corridor at some point; the first departure is at 5%, almost from the start; only a small part of the batch is outside, so this is a short, sharp deviation rather than a batch that ran wrong throughout.
The numbers. SPE 19378 against a limit of 520 (37.3x); 2.7% of the batch sits outside the golden corridor.
Driven by: paa_flow (94%), acid_flow_rate (1%), temperature (1%), ph (1%), cool_water_flow (1%)

What the chart shows. paa_flow carries most of it, running 32 sigma above the golden batch at 11% of the way through; 12 of 23 tags leave the corridor at some point; the first departure is at 0%, almost from the start; only a small part of the batch is outside, so this is a short, sharp deviation rather than a batch that ran wrong throughout.
The numbers. SPE 18538 against a limit of 520 (35.6x); 2.6% of the batch sits outside the golden corridor.
Driven by: paa_flow (51%), dumped_broth_flow (40%), sugar_feed_rate (2%), ph (1%), water_injection (1%)

What the chart shows. paa_flow carries most of it, running 35 sigma above the golden batch at 11% of the way through; 10 of 23 tags leave the corridor at some point; the first departure is at 10%, early in the batch.
The numbers. SPE 18507 against a limit of 520 (35.6x); 4.2% of the batch sits outside the golden corridor.
Driven by: paa_flow (48%), dumped_broth_flow (36%), ph (6%), base_flow_rate (3%), sugar_feed_rate (2%)
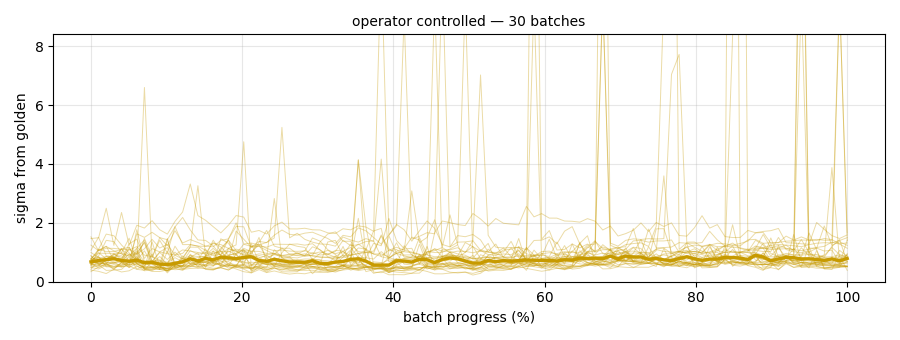
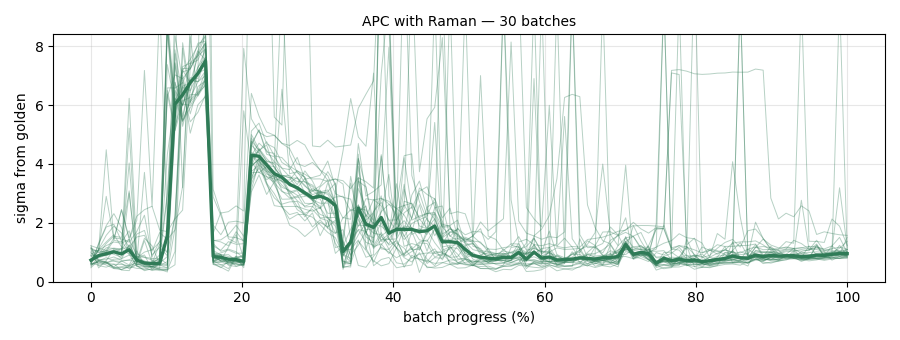
Each curve is one batch: how far it sits from the golden batch at that point of its progress, taken across all 23 tags at once. The bold line is the middle batch of the group. All four charts share the same scale, so they can be read against each other.
| Way of running it | Batches | Typical distance from golden | Worst batch | Mean yield | Beyond 10 sigma |
|---|---|---|---|---|---|
| recipe driven | 30 | 0.82 sigma | 152 sigma | 2,912,750 kg | 18 of 30 |
| operator controlled | 30 | 0.73 sigma | 178 sigma | 2,833,113 kg | 8 of 30 |
| APC with Raman | 30 | 0.95 sigma | 166 sigma | 3,484,283 kg | 30 of 30 |
| faulty | 10 | 1.20 sigma | 183 sigma | 2,600,203 kg | 10 of 10 |
Only the middle batch of each group, so the four are directly comparable.



| label | batch | strategy | band | max_z | sustained_z | worst_tag | worst_at_pct | outside_pct | first_outside_pct | T2 | SPE | yield_total_kg |
|---|---|---|---|---|---|---|---|---|---|---|---|---|
| Batch 67 - APC with Raman | 67 | APC with Raman | far from it (over 10 sigma) | 166 | 137.3 | ph | 47.5 | 20 | 2 | 25.36 | 3.054e+05 | 3.413e+06 |
| Batch 91 - faulty | 91 | faulty | far from it (over 10 sigma) | 155.5 | 144.7 | substrate_conc | 45.5 | 19.52 | 5.1 | 36.11 | 1.623e+05 | 2.597e+06 |
| Batch 95 - faulty | 95 | faulty | far from it (over 10 sigma) | 114.6 | 75.7 | acid_flow_rate | 62.6 | 12.78 | 10.1 | 20.92 | 4.98e+04 | 1.954e+06 |
| Batch 99 - faulty | 99 | faulty | far from it (over 10 sigma) | 134.9 | 95.9 | acid_flow_rate | 76.8 | 12.35 | 3 | 21 | 8.913e+04 | 8.908e+05 |
| Batch 29 - recipe driven | 29 | recipe driven | far from it (over 10 sigma) | 66.1 | 63.4 | paa_flow | 14.1 | 12 | 1 | 16.28 | 6.686e+04 | 1.842e+06 |
| Batch 3 - recipe driven | 3 | recipe driven | far from it (over 10 sigma) | 112.9 | 61.5 | acid_flow_rate | 98 | 11.96 | 1 | 17.02 | 5.879e+04 | 2.675e+06 |
| Batch 75 - APC with Raman | 75 | APC with Raman | far from it (over 10 sigma) | 61.8 | 51.5 | heat_water_flow | 14.1 | 10.61 | 2 | 15.48 | 3.138e+04 | 3.1e+06 |
| Batch 5 - recipe driven | 5 | recipe driven | far from it (over 10 sigma) | 66.7 | 66.1 | head_pressure | 21.2 | 10.35 | 2 | 14.12 | 8.248e+04 | 3.563e+06 |
| Batch 15 - recipe driven | 15 | recipe driven | far from it (over 10 sigma) | 66.7 | 65.4 | head_pressure | 21.2 | 10.35 | 2 | 11.76 | 6.912e+04 | 2.853e+06 |
| Batch 53 - operator controlled | 53 | operator controlled | far from it (over 10 sigma) | 52.3 | 45.9 | water_injection | 38.4 | 9.78 | 0 | 18.66 | 1.705e+04 | 2.858e+06 |
| Batch 73 - APC with Raman | 73 | APC with Raman | far from it (over 10 sigma) | 45.9 | 38.5 | dumped_broth_flow | 42.4 | 9.17 | 5.1 | 15.35 | 2.06e+04 | 3.549e+06 |
| Batch 94 - faulty | 94 | faulty | far from it (over 10 sigma) | 183.3 | 107.9 | aeration_rate | 46.5 | 7.17 | 9.1 | 33.99 | 1.088e+05 | 3.584e+06 |
| Batch 61 - APC with Raman | 61 | APC with Raman | far from it (over 10 sigma) | 45.9 | 38.9 | dumped_broth_flow | 54.5 | 6.39 | 3 | 11.63 | 1.785e+04 | 3.063e+06 |
| Batch 45 - operator controlled | 45 | operator controlled | similar (2-5 sigma) | 4.4 | 4.4 | head_pressure | 38.4 | 6.35 | 3 | 17.87 | 5.032 | 2.828e+06 |
| Batch 17 - recipe driven | 17 | recipe driven | far from it (over 10 sigma) | 65.4 | 53.5 | water_injection | 26.3 | 5.57 | 2 | 11.38 | 3.974e+04 | 3.852e+06 |
| Batch 85 - APC with Raman | 85 | APC with Raman | far from it (over 10 sigma) | 45.9 | 42.4 | dumped_broth_flow | 75.8 | 5.57 | 6.1 | 8.867 | 1.524e+04 | 4.044e+06 |
| Batch 100 - faulty | 100 | faulty | far from it (over 10 sigma) | 183.3 | 109.2 | aeration_rate | 46.5 | 5.52 | 9.1 | 18.9 | 1.049e+05 | 1.555e+06 |
| Batch 97 - faulty | 97 | faulty | far from it (over 10 sigma) | 162.4 | 50.8 | acid_flow_rate | 76.8 | 4.91 | 9.1 | 8.151 | 4.587e+04 | 3.894e+06 |
| Batch 9 - recipe driven | 9 | recipe driven | far from it (over 10 sigma) | 152.1 | 45.9 | acid_flow_rate | 60.6 | 4.57 | 10.1 | 10.17 | 4.727e+04 | 4.083e+06 |
| Batch 35 - operator controlled | 35 | operator controlled | similar (2-5 sigma) | 4.4 | 4.4 | head_pressure | 15.2 | 4.39 | 1 | 17.75 | 9.199 | 3.538e+06 |
| Batch 23 - recipe driven | 23 | recipe driven | far from it (over 10 sigma) | 56.1 | 39.1 | paa_flow | 15.2 | 4.17 | 3 | 7.662 | 1.089e+04 | 2.855e+06 |
| Batch 69 - APC with Raman | 69 | APC with Raman | far from it (over 10 sigma) | 45.9 | 42.7 | dumped_broth_flow | 58.6 | 4.17 | 10.1 | 3.815 | 1.851e+04 | 3.751e+06 |
| Batch 89 - APC with Raman | 89 | APC with Raman | far from it (over 10 sigma) | 38.1 | 31.9 | paa_flow | 39.4 | 3.65 | 5.1 | 8.008 | 1.549e+04 | 3.291e+06 |
| Batch 93 - faulty | 93 | faulty | far from it (over 10 sigma) | 135.2 | 23.5 | temperature | 42.4 | 3.65 | 1 | 15.13 | 2.317e+04 | 4.448e+06 |
| Batch 66 - APC with Raman | 66 | APC with Raman | far from it (over 10 sigma) | 32.4 | 27.8 | paa_flow | 12.1 | 3.48 | 3 | 7.151 | 1.058e+04 | 3.843e+06 |
| Batch 83 - APC with Raman | 83 | APC with Raman | far from it (over 10 sigma) | 45.9 | 38.1 | dumped_broth_flow | 54.5 | 3.26 | 5.1 | 7.593 | 1.742e+04 | 3.837e+06 |
| Batch 77 - APC with Raman | 77 | APC with Raman | far from it (over 10 sigma) | 45.9 | 37.7 | dumped_broth_flow | 49.5 | 3.26 | 10.1 | 4.764 | 1.685e+04 | 3.812e+06 |
| Batch 7 - recipe driven | 7 | recipe driven | far from it (over 10 sigma) | 74.9 | 65.2 | ph | 85.9 | 3.22 | 1 | 13.16 | 3.635e+04 | 3.455e+06 |
| Batch 71 - APC with Raman | 71 | APC with Raman | far from it (over 10 sigma) | 45.9 | 45.9 | dumped_broth_flow | 47.5 | 3.17 | 6.1 | 7.535 | 2.09e+04 | 2.831e+06 |
| Batch 78 - APC with Raman | 78 | APC with Raman | far from it (over 10 sigma) | 38.6 | 33.9 | paa_flow | 12.1 | 3.04 | 1 | 6.8 | 1.146e+04 | 3.589e+06 |
| Batch 68 - APC with Raman | 68 | APC with Raman | far from it (over 10 sigma) | 66.1 | 39.5 | paa_flow | 38.4 | 2.87 | 2 | 5.917 | 1.783e+04 | 3.573e+06 |
| Batch 59 - operator controlled | 59 | operator controlled | far from it (over 10 sigma) | 172 | 45.9 | acid_flow_rate | 84.8 | 2.87 | 7.1 | 8.357 | 4.227e+04 | 2.91e+06 |
| Batch 70 - APC with Raman | 70 | APC with Raman | far from it (over 10 sigma) | 66.1 | 42.6 | paa_flow | 38.4 | 2.7 | 5.1 | 6.664 | 1.938e+04 | 3.308e+06 |
| Batch 44 - operator controlled | 44 | operator controlled | similar (2-5 sigma) | 4.3 | 3.8 | heat_water_flow | 39.4 | 2.65 | 9.1 | 12.24 | 185.8 | 1.474e+06 |
| Batch 87 - APC with Raman | 87 | APC with Raman | far from it (over 10 sigma) | 45.9 | 42 | dumped_broth_flow | 45.5 | 2.61 | 0 | 9.026 | 1.854e+04 | 3.471e+06 |
| Batch 6 - recipe driven | 6 | recipe driven | far from it (over 10 sigma) | 14.5 | 8.7 | acid_flow_rate | 37.4 | 2.43 | 6.1 | 7.081 | 1945 | 2.389e+06 |
| Batch 64 - APC with Raman | 64 | APC with Raman | far from it (over 10 sigma) | 46.7 | 32.1 | paa_flow | 39.4 | 2.3 | 0 | 5.027 | 1.356e+04 | 3.362e+06 |
| Batch 84 - APC with Raman | 84 | APC with Raman | far from it (over 10 sigma) | 37.6 | 33.6 | paa_flow | 15.2 | 2.13 | 0 | 7.492 | 1.071e+04 | 3.488e+06 |
| Batch 11 - recipe driven | 11 | recipe driven | far from it (over 10 sigma) | 19.3 | 14.3 | sugar_feed_rate | 38.4 | 2.13 | 6.1 | 6.103 | 2385 | 1.965e+06 |
| Batch 81 - APC with Raman | 81 | APC with Raman | far from it (over 10 sigma) | 45.9 | 35.7 | dumped_broth_flow | 59.6 | 2.09 | 7.1 | 2.378 | 1.536e+04 | 3.186e+06 |
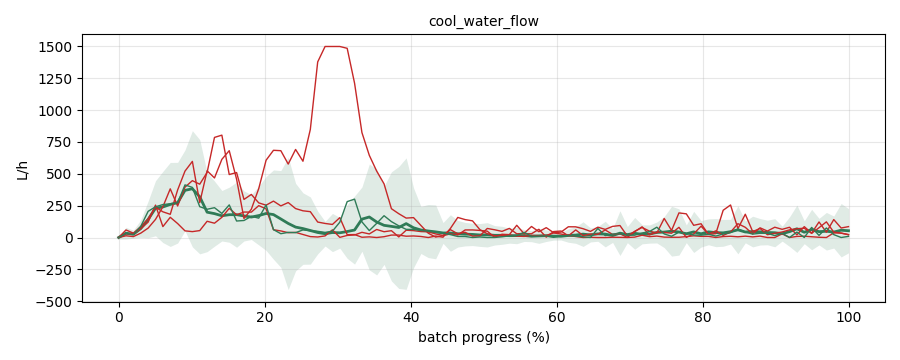
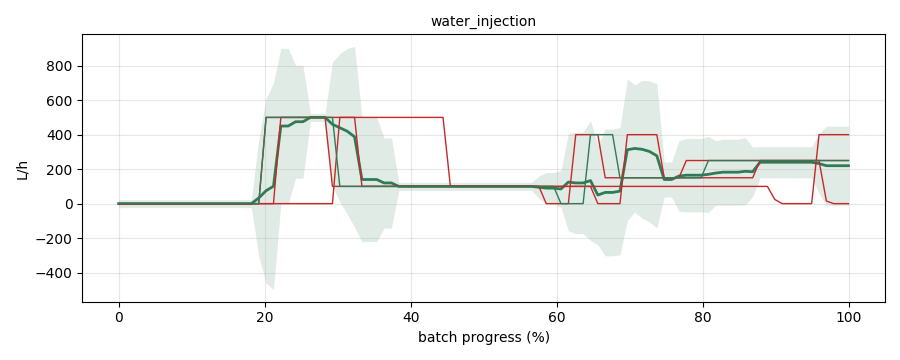
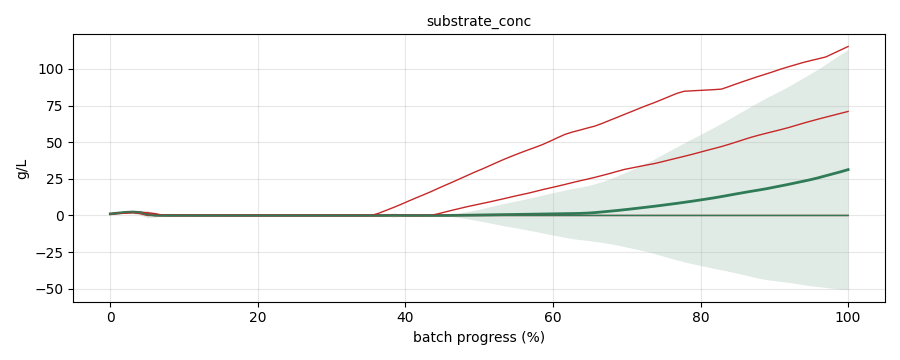
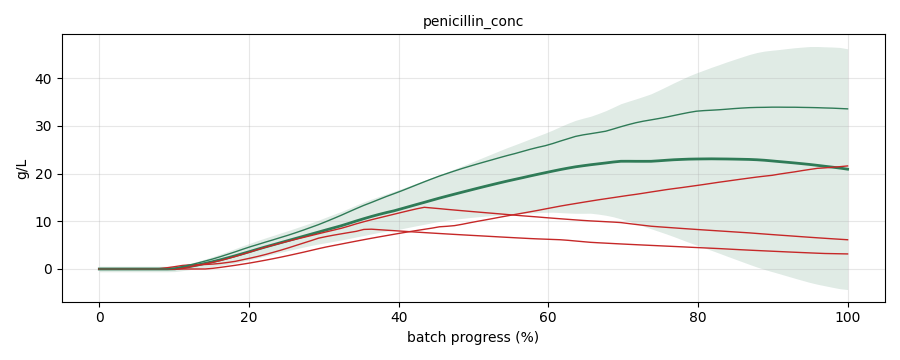
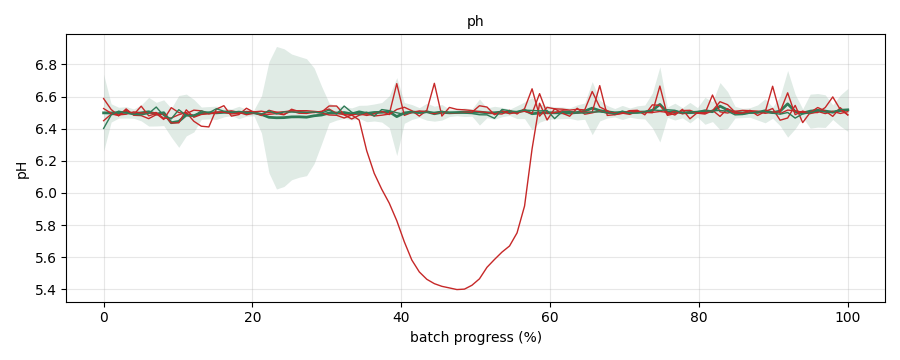
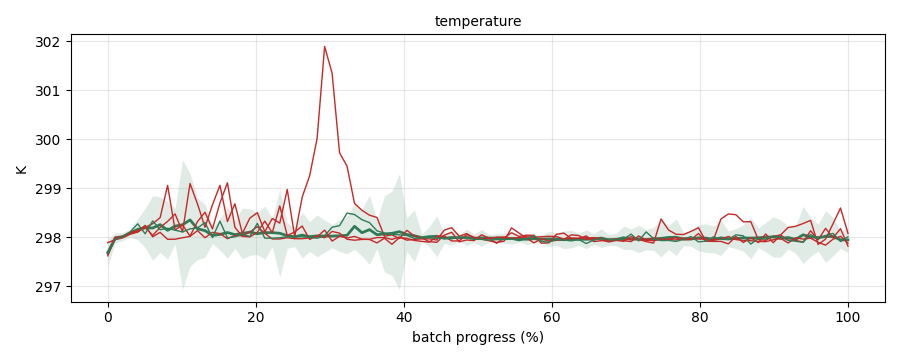
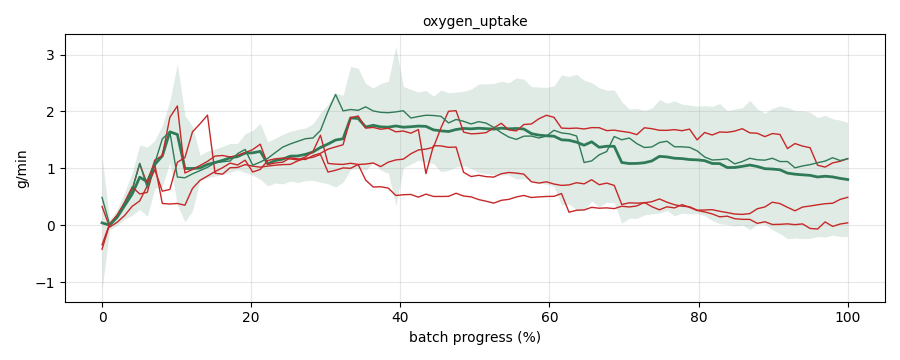
The green band is where a good batch is expected to be at each point of its progress. The worst batches are drawn over it in red, and one reference batch in green for comparison. Drag to zoom, double-click to reset, click a name in the legend to hide it.












| Way of running it | Batches | Mean yield (kg) | Spread (CV) | Worst batch | Best batch | Mean hours | kg per hour |
|---|---|---|---|---|---|---|---|
| recipe driven | 30 | 2,912,750 | 26.4% | 1,842,400 | 4,083,100 | 228.8 | 12,917 |
| operator controlled | 30 | 2,833,113 | 24.0% | 1,474,100 | 4,196,000 | 229.2 | 12,431 |
| APC with Raman | 30 | 3,484,283 | 8.8% | 2,830,800 | 4,044,300 | 224.7 | 15,587 |
| Comparison | Difference | Welch p | Mann-Whitney p | Cohen d | Significant | |
|---|---|---|---|---|---|---|
| recipe driven vs operator controlled | +79,637 kg | +2.8% | 6.7e-01 | 8.9e-01 | +0.11 | no |
| recipe driven vs APC with Raman | -571,533 kg | -16.4% | 5.3e-04 | 1.1e-02 | -0.98 | yes |
| operator controlled vs APC with Raman | -651,170 kg | -18.7% | 2.3e-05 | 4.4e-05 | -1.23 | yes |
One real batch per strategy, chosen on two criteria at once: high yield and close to that group's own mean trajectory. The highest-yielding batch is often a lucky outlier that ran unlike anything else, and the most typical batch is often mediocre. These are both.
| Way of running it | Golden batch | Yield | Yield rank | Closeness rank |
|---|---|---|---|---|
| recipe driven | Batch 26 - recipe driven | 3,886,800 kg | 4 of 30 | 2 of 30 |
| operator controlled | Batch 60 - operator controlled | 3,802,300 kg | 3 of 30 | 5 of 30 |
| APC with Raman | Batch 79 - APC with Raman | 3,825,600 kg | 5 of 30 | 2 of 30 |
A golden batch is built from one strategy, holding back some of its own batches, and every group is then scored against it. The figure is the median batch's typical distance, in sigma. The shaded cell on the diagonal is that strategy's own held-back batches — the fair self-comparison, and it should be the lowest number in its row.
| Golden built from | recipe driven | operator controlled | APC with Raman | faulty |
|---|---|---|---|---|
| recipe driven | 0.77 | 1.07 | 1.08 | 1.11 |
| operator controlled | 0.82 | 0.74 | 0.95 | 1.20 |
| APC with Raman | 1.05 | 1.35 | 0.66 | 12.51 |
| Golden built from | Its own held-back batches | The other strategies | How much further | Fault detection power |
|---|---|---|---|---|
| recipe driven | 0.77 | 1.07 | 1.40x | 1.4x |
| operator controlled | 0.74 | 0.89 | 1.20x | 1.6x |
| APC with Raman | 0.66 | 1.20 | 1.82x | 19.0x |
Folder: /Volumes/YN-4T/WIP/CTRL-Designer/B-CDL-Data-Analysis/E-Batch/IndPenSim-Golden-Operator
© 2026 CTRL Designer LLC. All rights reserved.
Yahya Nazer · info@ctrlDesigner.com